2026 Best Injection Molding Companies for Global Buyers
Choosing reliable Injection Molding Companies in 2026 requires more than comparing quoted prices. Global buyers need evidence of process control, engineering capability, delivery discipline, and responsible material management. Grand View Research estimates that the global injection molded plastics market will continue expanding through 2030, supported by automotive, medical, electronics, and consumer-product demand. Fortune Business Insights also projects steady growth in the injection molding machine market during the same period. These figures suggest opportunity, but they do not guarantee supplier quality.
The strongest manufacturers combine modern equipment with practical production experience. Look for documented ISO 9001 systems, validated tooling procedures, mold-flow analysis, automated inspection, and traceable batch records. Automotive suppliers may also require IATF 16949, while medical projects often demand specialized quality controls and regulatory documentation. A capable factory should explain its clamp force, resin drying process, cycle-time assumptions, and tolerance limits without hiding behind marketing language. Ask for sample parts. Study the gate marks, warpage, surface finish, and packaging details.
Not every impressive website reflects a dependable plant. That matters.
This 2026 guide evaluates Injection Molding Companies through measurable criteria, including tooling expertise, production scalability, certifications, communication, sustainability practices, and total landed cost. Data from industry reports provides useful market context, while direct factory audits and customer references offer stronger evidence. Some rankings remain imperfect, because supplier performance can change with staffing, capacity, or raw-material conditions. Buyers should verify current certifications and inspect representative samples before signing long-term agreements.
Set 2026 Selection Criteria: 50–4,000+ Ton Presses and Global Reach
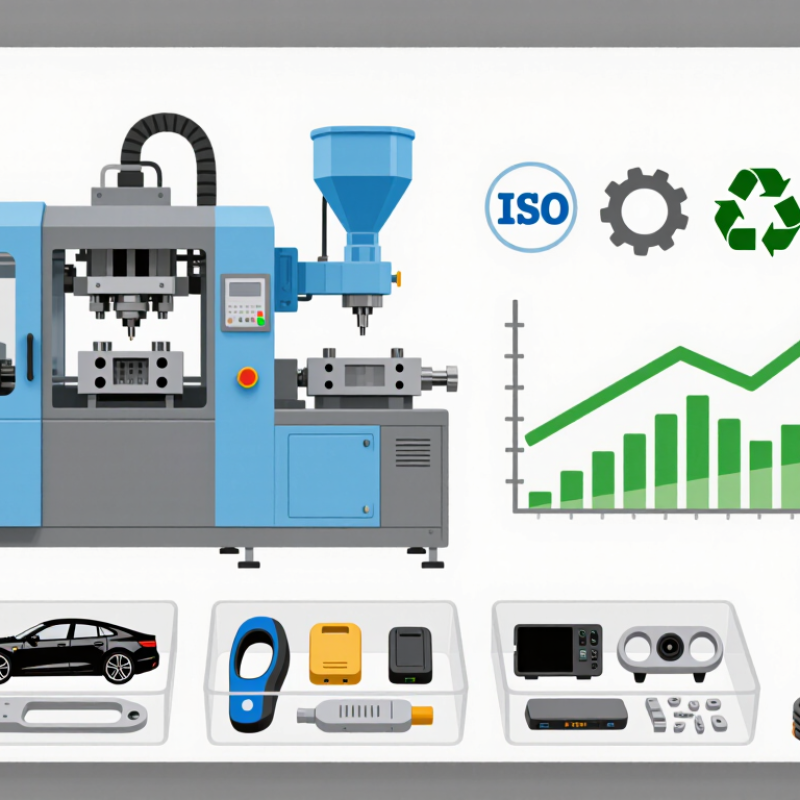
For 2026 sourcing, evaluate molding companies by press range, not brochures. A 50-ton press suits small, precise components, while 4,000-plus tons support large housings, pallets, and structural parts. Grand View Research estimates the global injection molding machine market will grow steadily through 2030. Capacity is expanding, but not every supplier can control quality across that range.
A practical audit should verify clamp-force records, mold trials, process capability, and maintenance logs. Check whether the facility can hold stable temperatures during long production runs. Also review metrology equipment, resin traceability, and corrective-action records. ISO 9001 certification helps, but it does not replace factory evidence.
Global reach means more than exporting products. Ask about engineering support, spare-parts access, multilingual documentation, and regional quality response. The OECD Global Plastics Outlook projects annual plastic waste could rise from 353 million tonnes in 2019 to 1,014 million tonnes by 2060. Recycled-material capability therefore deserves a clear question: can the supplier manage variable moisture, color, and viscosity?
Tonnage alone misleads. Sadly, it happens often. A smaller press with disciplined process control may outperform a larger machine on tight tolerances. Buyers should compare sample parts, inspection data, delivery history, and realistic production capacity. That evidence is less impressive than a factory tour, but usually more useful.
Screen Suppliers by ISO 9001, IATF 16949, and ISO 13485 Certification
2026 Best Injection Molding Companies for Global Buyers
Screen Suppliers by ISO 9001, IATF 16949, and ISO 13485 Certification
Certification should guide your shortlist, not replace supplier audits. The ISO Survey 2023 recorded over 1.2 million ISO 9001 certificates worldwide. It also reported more than 38,000 ISO 13485 certificates. These figures show broad adoption, but certificate numbers do not prove consistent molding performance. Ask for the certificate scope, issuing body, site address, and expiry date. A certificate covering design or assembly may not cover injection molding.
For automotive parts, IATF 16949 screening reveals stronger process discipline. Review control plans, measurement records, mold maintenance logs, and nonconformance actions. For medical components, ISO 13485 evidence should connect quality risks with traceability, validation, and change control. A capable supplier should explain resin storage, cavity inspection, and batch identification without vague answers. Production evidence matters more than polished presentations.
Tips: Request three recent audit findings and their closure records. Check whether the certified facility actually produces your parts. Compare first-pass yield, defect trends, and response times. The Plastics Industry Association reports that plastics manufacturing remains a major industrial employer in the United States, yet labor pressure can affect inspection consistency. Do not assume every certified site performs equally. That assumption needs testing.
Compare SPI Class 101–105 Tooling, Mold Life, and Maintenance Data
For global buyers, SPI tooling classes offer a practical way to compare mold life and maintenance expectations. Class 101 molds are built for demanding production, often exceeding one million cycles with hardened steel and replaceable wear components. Class 102 tools usually support high-volume work, commonly reaching 500,000 to one million cycles. Actual life depends on resin, part geometry, clamping force, and operator discipline.
Class 103 molds suit medium-volume programs and may deliver about 250,000 cycles under stable conditions. Class 104 tools are intended for limited production, with typical life below 100,000 cycles. Class 105 molds are prototype tools and may provide fewer than 500 cycles. These figures are planning ranges, not promises. A poorly balanced runner system can shorten any mold’s service life.
Maintenance records reveal more than a sales quotation. Buyers should request inspection intervals, cavity-pressure checks, lubrication records, spare-part lists, and documented repair history. High-volume tools often need cleaning and visual inspection after each production run, while detailed dimensional checks may occur every 100,000 cycles. Cooling channels deserve special attention; scale buildup can create uneven shrinkage and longer cycle times.
Some suppliers report cycle targets without showing failure data. That deserves questions. My own review standard favors traceable records, sample maintenance reports, and clear ownership of replacement parts. The comparison is imperfect. Still, evidence usually beats optimistic estimates.
Rank Total Cost, Lead Time, DFM Support, Quality KPIs, and Supply Risk
For global buyers, injection molding cost is more than the quoted piece price. A reliable comparison includes tooling, sampling, freight, duties, packaging, payment terms, and expected scrap. I review at least three quotations using the same annual volume and material grade. One supplier may look cheaper, yet charge more for mold changes or express shipping. Total cost needs real purchase records, not optimistic estimates.
Lead time should be measured from approved drawings to the first acceptable shipment. Ask for a dated production schedule. Strong manufacturers explain DFM decisions with marked-up drawings, mold-flow findings, and practical changes to wall thickness, draft, or gate location. This support can prevent sink marks and difficult ejection. It also reveals whether engineers understand production, not only software.
Quality KPIs should include defect rate, first-pass yield, Cpk for critical dimensions, on-time delivery, and corrective-action closure time. Request twelve months of records where possible. Inspect lot traceability and retain sample procedures. Supply risk deserves equal attention: resin availability, backup tooling capacity, maintenance planning, and dependence on one raw-material source. A factory audit helps, but one visit can create false confidence. My own scorecards have missed communication delays and late engineering responses. That weakness must be recorded, not hidden. A clear escalation path, weekly updates, and evidence-based reviews make supplier decisions more dependable.
2026 Best Injection Molding Companies for Global Buyers - Rank Total Cost, Lead Time, DFM Support, Quality KPIs, and Supply Risk
Methodology: The table uses anonymous supplier profiles and industry-standard procurement metrics. The Total Cost Index combines quoted part price, tooling, logistics, quality exposure, and typical program-management costs. Lead times are indicative ranges for standard thermoplastic injection-molding programs and may vary with part size, resin, tooling complexity, validation requirements, and annual volume. Quality figures represent commonly targeted supplier KPIs rather than audited results for any named company.